
Good Charts: The HBR Guide to Making Smarter, More Persuasive Data Visualizations by Scott Berinato is a comprehensive guide aimed at helping individuals and organizations create effective and impactful data visualizations. The book emphasizes the importance of good charts in communicating ideas and influencing decision-making processes.
The book begins by exploring the fundamental principles of data visualization. Berinato explains that good charts are not just about aesthetics but about clarity and effectiveness in conveying information. He introduces the concept of “data storytelling,” where visualizations are used to tell a compelling story that resonates with the audience.
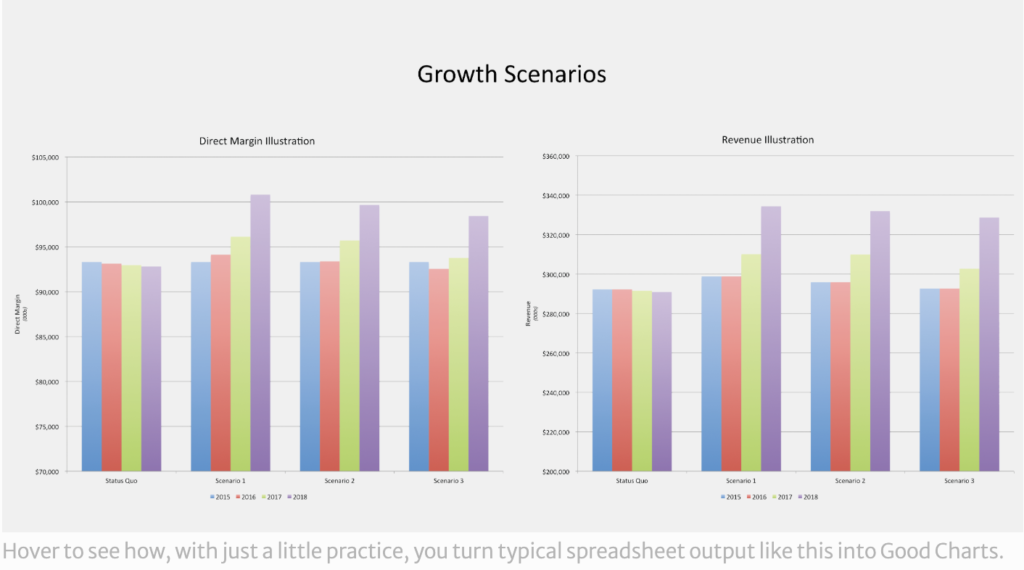
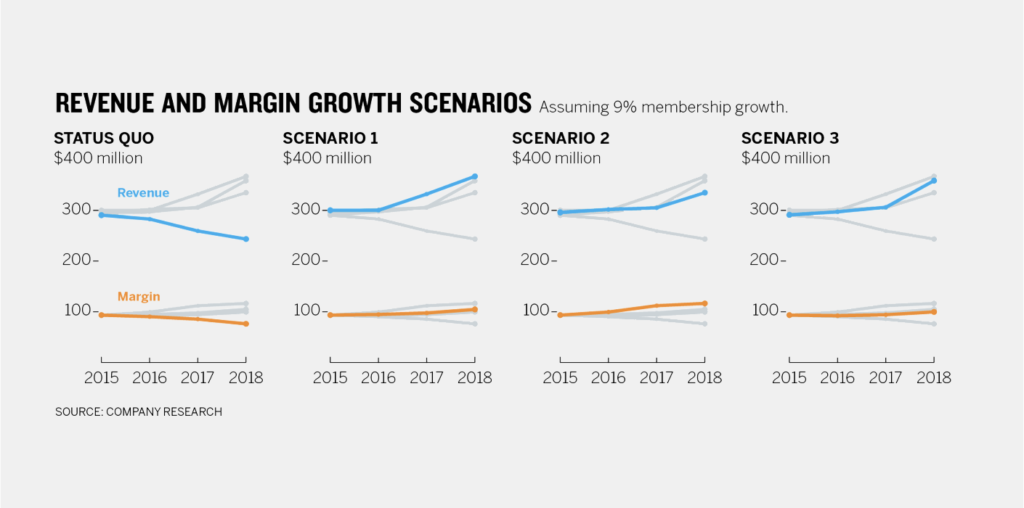
Berinato provides a detailed framework for creating effective charts, starting with understanding the audience and the message you want to convey. He emphasizes the importance of context and how different types of charts can be used to highlight specific aspects of the data. The book includes practical tips on choosing the right chart type, designing for clarity, and avoiding common pitfalls.
One of the key strengths of the book is its focus on the process of creating visualizations. Berinato outlines a step-by-step approach that includes talking, sketching, and prototyping. This iterative process helps ensure that the final visualization is both accurate and engaging. He also discusses the importance of feedback and how to incorporate it into the design process.
The book also delves into the psychological aspects of data visualization. Berinato draws on research in visual perception and neuroscience to explain why certain visualizations work better than others. He discusses how to use color, shape, and layout to guide the viewer’s attention and make the data more understandable.
In addition to technical guidance, Berinato emphasizes the importance of storytelling in data visualization. He provides examples of how to craft a narrative around the data, making it more relatable and memorable for the audience. This approach helps ensure that the visualization not only informs but also persuades and inspires action.
Finally, Berinato addresses the challenges of creating visualizations in a business context. He offers advice on how to present data to different stakeholders, from executives to team members, and how to use visualizations to support strategic decision-making. The book includes case studies and examples from various industries, illustrating how good charts can drive business success.
Overall, Good Charts is an invaluable resource for anyone looking to improve their data visualization skills. Whether you’re a data analyst, a business leader, or a designer, this book provides the tools and insights needed to create visualizations that are not only visually appealing but also highly effective in communicating complex information.

About the Author:
Scott Berinato is a senior editor at Harvard Business Review (HBR) and a recognized expert in data visualization. He has a background in journalism and has written extensively on topics related to technology, business, and data. Berinato is known for his ability to make complex subjects accessible and engaging, and he has a particular interest in the intersection of data, design, and storytelling.
Link to buy: Good Charts
+VIDEO: