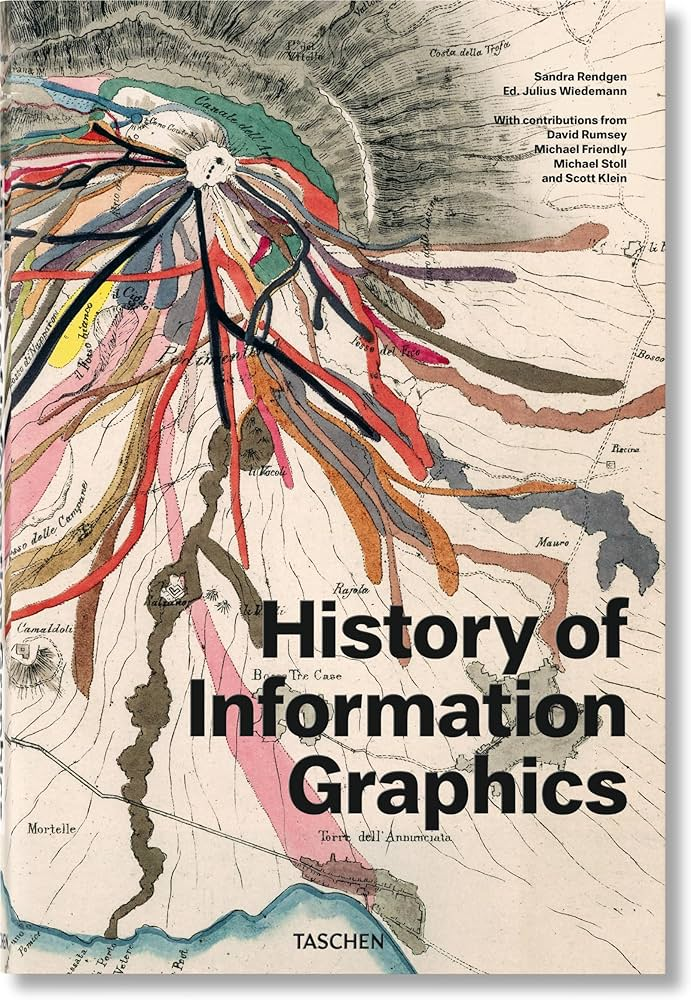
The book History of Information Graphics, edited by Sandra Rendgen, is a monumental exploration of how humans have used visual tools to understand and communicate complex information. Spanning centuries of innovation, this richly illustrated volume traces the development of information graphics from medieval manuscripts to modern data visualizations. With over 400 examples, it offers a comprehensive look at the intersection of art, science, and communication.
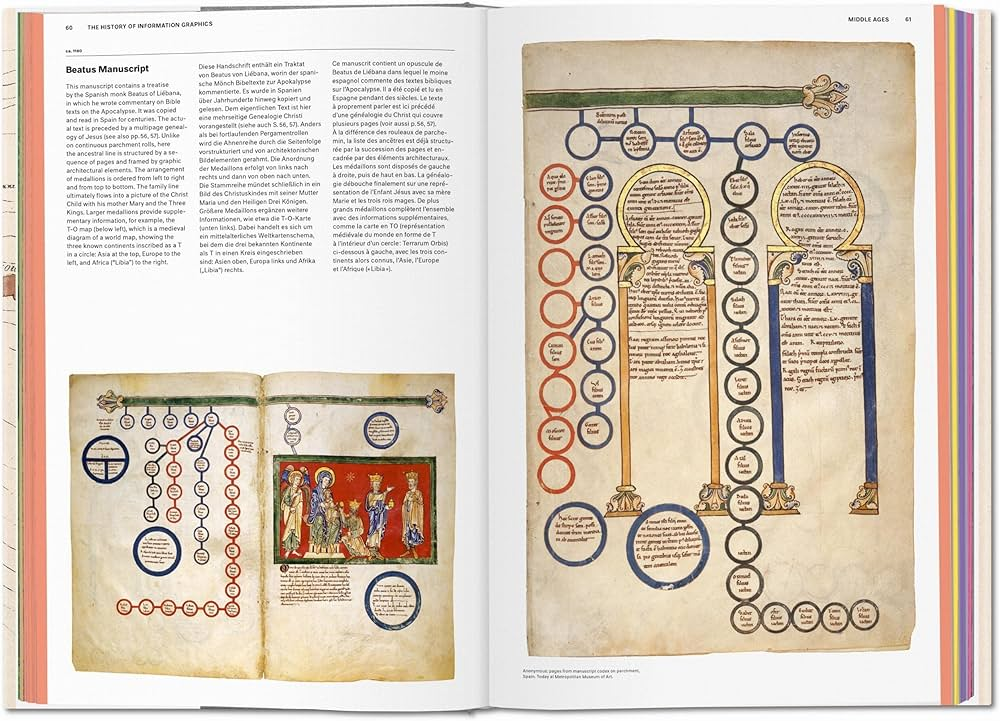
One of the book’s most compelling features is its chronological structure, which allows readers to witness the gradual sophistication of visual communication. Early examples include celestial charts, anatomical drawings, and cartographic masterpieces that reveal how early thinkers attempted to map the world and the human body. These graphics were not only scientific tools but also works of art, often hand-drawn with meticulous detail and aesthetic care.
As the book progresses into the Enlightenment and Industrial Age, it highlights how the rise of empirical science and mass printing revolutionized information design. Statistical charts, engineering diagrams, and educational illustrations became more standardized and accessible. This period saw the emergence of pioneers like William Playfair, who invented bar and pie charts, and Florence Nightingale, who used graphics to advocate for public health reform.
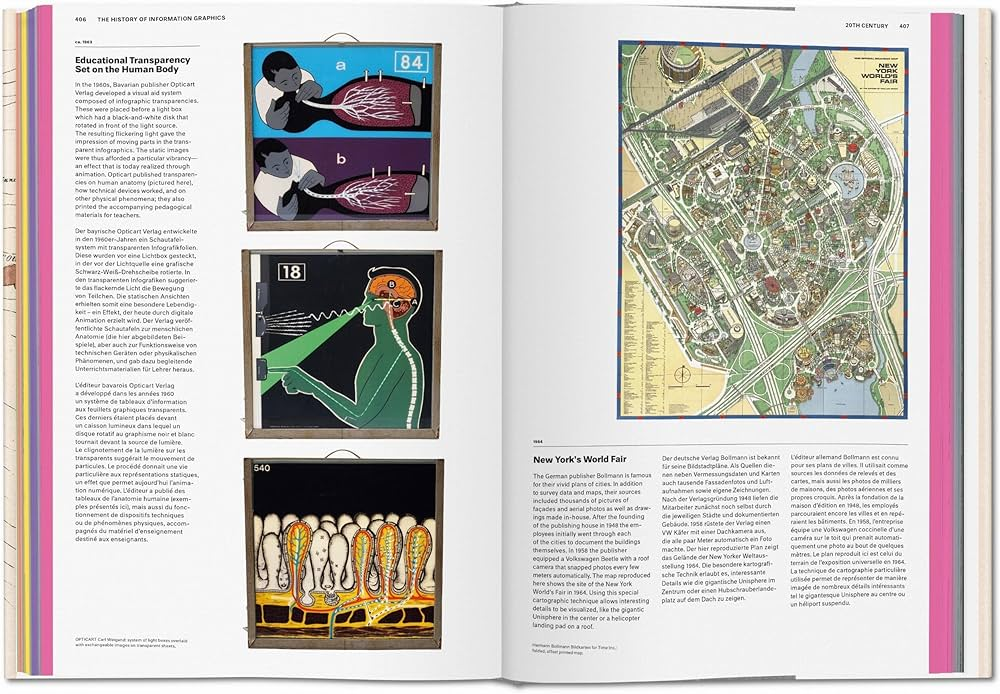
The 20th century brought a new wave of innovation with the advent of computing and digital design. The book showcases how information graphics evolved into powerful tools for journalism, education, and business. From subway maps to infographics in newspapers, the visual language of data became more refined, intuitive, and widespread. The influence of designers like Edward Tufte and Otto Neurath is evident in this era’s emphasis on clarity, minimalism, and user-centered design.
What makes History of Information Graphics particularly valuable is its interdisciplinary approach. It draws from fields as diverse as astronomy, zoology, medicine, and economics, demonstrating that the need to visualize information transcends academic boundaries. Each graphic is accompanied by insightful commentary that contextualizes its creation, purpose, and impact, making the book both educational and visually captivating.
The book’s large format and high-quality reproductions make it a tactile and immersive experience. Readers can appreciate the fine details of historical documents that are rarely seen outside of archives and museums. This physicality reinforces the idea that information graphics are not just functional—they are cultural artifacts that reflect the values, knowledge, and aesthetics of their time.
In an age where data is ubiquitous and often overwhelming, History of Information Graphics serves as a reminder of the enduring power of visual storytelling. It shows that the challenge of making sense of complex information is not new, and that the solutions developed over centuries still inform today’s best practices in design and communication.
Ultimately, this book is more than a visual history — it is a celebration of human curiosity and creativity. By chronicling the evolution of information graphics, Sandra Rendgen and her collaborators have created a vital resource for designers, historians, educators, and anyone interested in how we see and understand the world.

About the author:
Sandra Rendgen is a German author and editor specializing in the history of information graphics, data visualization, and interactive media. With a background in art history and cultural theory, she brings a scholarly yet accessible approach to visual communication. Her work, including titles like Information Graphics and Understanding the World, explores how visuals have been used across centuries to convey complex ideas, making her a leading voice in the field of data-driven storytelling.
Link to buy: History of Information Graphics
+VIDEO: