
The “Data to Viz” website is an essential tool for professionals in Data Visualization and Data Storytelling, offering a structured and practical approach to choosing the best data visualizations. This article explores the main features of the site and why it is an excellent reference for professionals in the field.
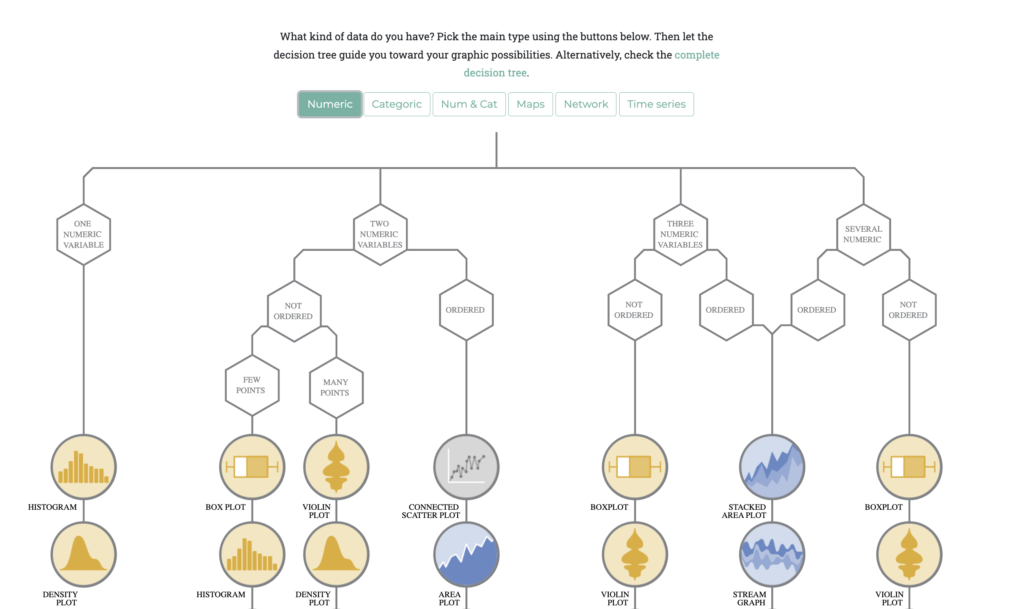
“Data to Viz” guides users in choosing the most appropriate chart for their data using a decision tree based on the format of the input data. This helps simplify the chart selection process, making it more efficient and effective.
The site offers examples of analyses based on real data using the R programming language. This not only demonstrates the practical application of visualizations but also provides reproducible code that users can adapt for their own projects.
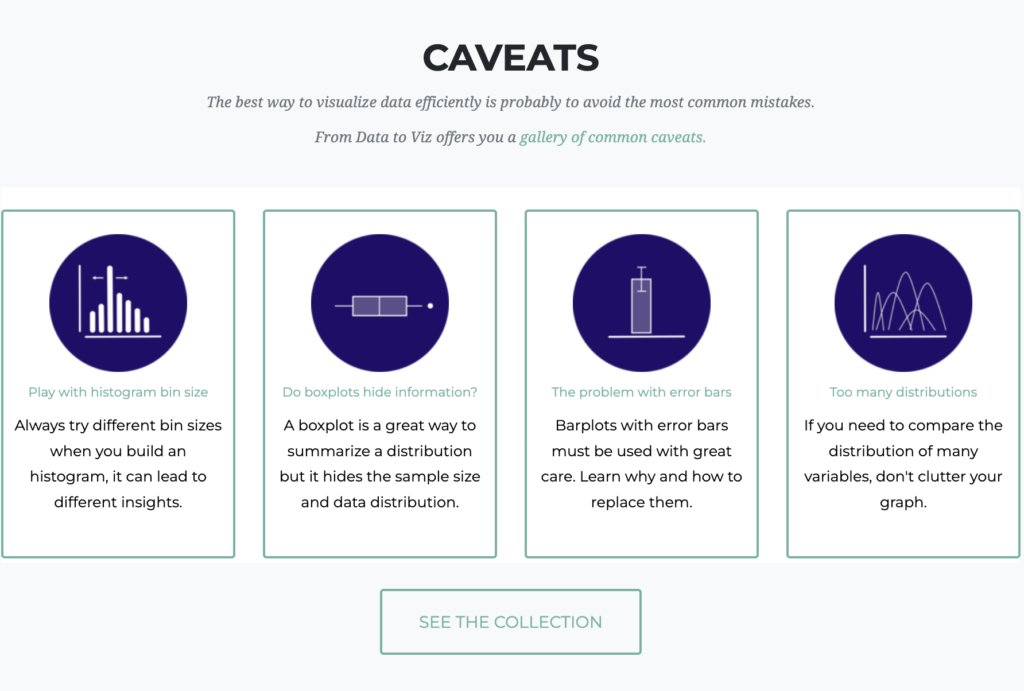
One of the great advantages of “Data to Viz” is the list of common pitfalls in data visualization. The site highlights frequent errors, such as cutting the Y-axis or creating line charts with too many lines, known as spaghetti charts. These tips help professionals avoid practices that can compromise the clarity and accuracy of visualizations.
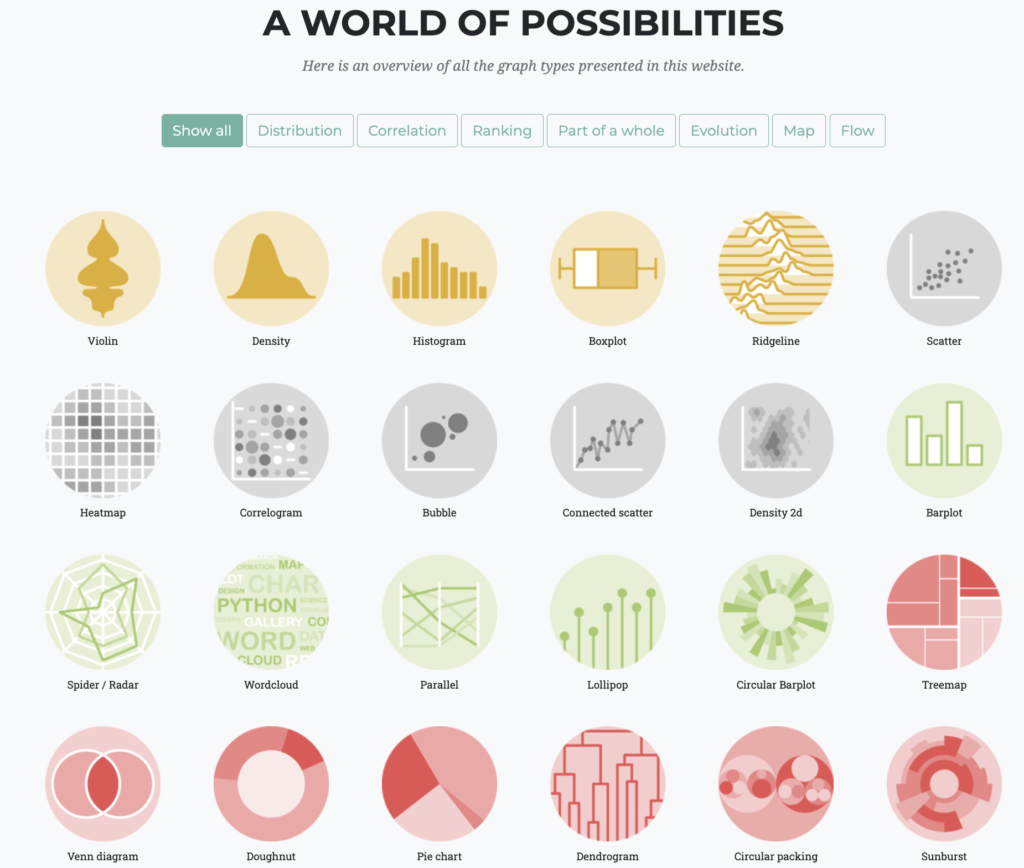
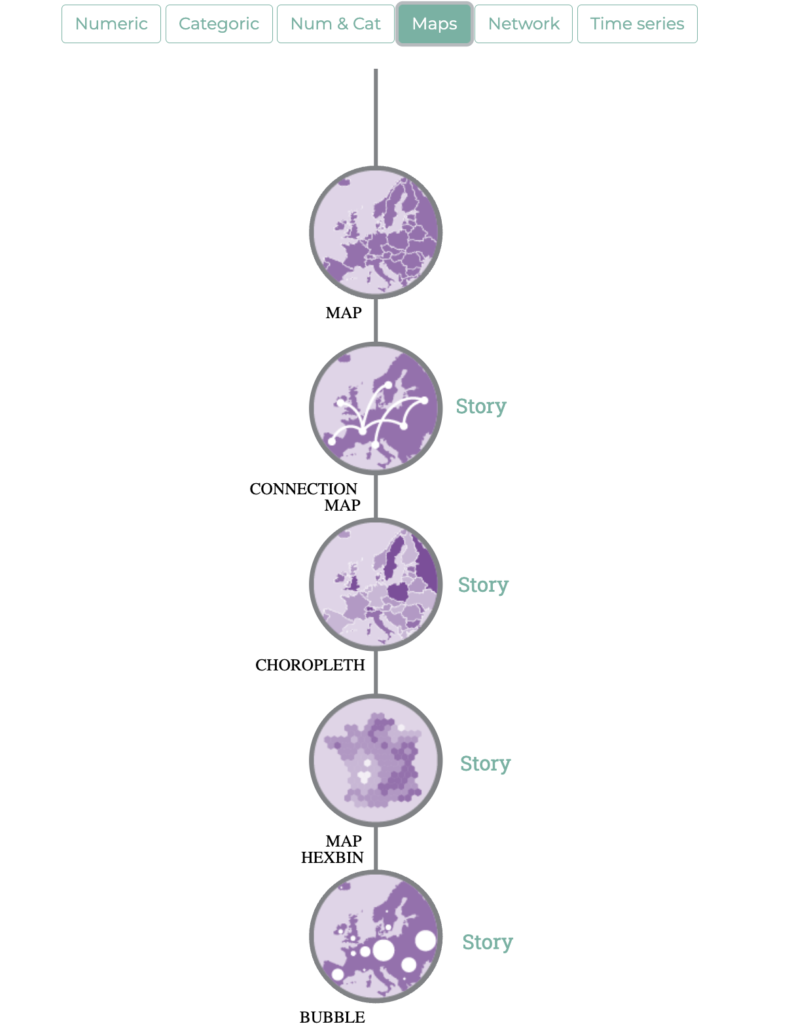
The site also features a comprehensive gallery of chart types, including distribution, correlation, ranking, part-to-whole, evolution, maps, and flow charts. Each chart type is accompanied by examples and detailed explanations, making it easier to understand and apply correctly.
Interactivity is a key component of “Data to Viz.” The site allows users to explore different types of charts and see how they can be applied to different datasets. This is particularly useful for professionals who need to experiment with various options before deciding which visualization to use.
In addition to traditional charts, the site also addresses more advanced visualizations, such as chord diagrams, network graphs, and heat maps. These visualizations are essential for representing complex data in a clear and intuitive manner.
“Data to Viz” is an excellent source of inspiration for professionals looking for new ways to present their data. The variety of charts and practical examples helps expand users’ visualization repertoires, encouraging creativity and innovation.
The site is maintained by two friends from southern France, Yan Holtz and Conor Healy, who combine their skills in data analysis and design to create a valuable resource for the data visualization community. Their dedication and knowledge are evident in the quality and usefulness of the content offered.
The site’s tools section includes additional resources, such as tutorials and links to R packages that facilitate the creation of visualizations. These resources are particularly useful for professionals who want to deepen their technical knowledge and improve their practical skills.
“Data to Viz” also offers a high-quality poster that summarizes the decision tree and chart types. This poster is a practical tool to have on hand in the workplace, serving as a quick guide for choosing visualizations.
In summary, “Data to Viz” is an invaluable resource for data professionals. With its structured approach, practical examples, useful tips, and a wide variety of chart types, the site offers everything professionals need to create effective and impactful visualizations.
The underlying philosophy of “Data to Viz” is that both the data and the context determine the appropriate chart. This holistic approach ensures that visualizations not only accurately represent the data but also tell a meaningful and engaging story.
#datavizmagic #tools #datastorytelling #datavisualization #fromdatatoviz #dataviz