
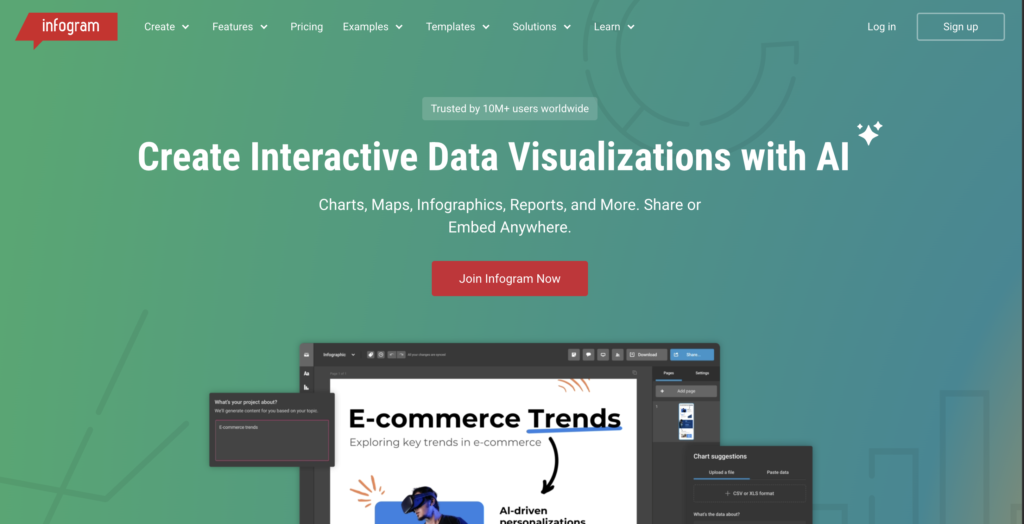
Data visualization and data storytelling are essential tools for transforming complex information into comprehensible and engaging stories. The site “Infogram” offers a powerful platform for creating interactive data visualizations and infographics that capture the audience’s attention. This article explores how the principles of data visualization and data storytelling are applied on Infogram to effectively communicate information.
Infogram is an easy-to-use, AI-powered tool for creating infographics, charts, dashboards, maps, and more. The platform allows users to design and share interactive data visualizations across various platforms, making data communication more accessible and engaging.
Data storytelling is a practice where content, context, and design come together to create a compelling narrative with data at its center. On Infogram, data storytelling enables users to convey important insights using text and visuals. This is especially useful for communicating complex information in a clear and memorable way.
A notable example of data visualization on Infogram is the interactive annual report by B Lab Global. This report combines functionality and visual storytelling, allowing viewers to click on elements, charts, and texts to explore specific sections of the report. The intuitive navigation and visual design elevate the report, transforming it from a static document into a dynamic experience.
Data storytelling is crucial for making data comprehensible and memorable. On Infogram, users can create powerful data stories that elevate content, regardless of the topic. Whether preparing a financial report, publishing engaging news, or presenting data to students, data storytelling helps communicate the message effectively.
Data visualization allows users to reveal patterns, draw conclusions, make better decisions, and inspire actions based on the data found. For example, business decisions can be improved based on insights discovered in the latest market analysis. Visual storytelling helps make this information more digestible and understandable for the audience.
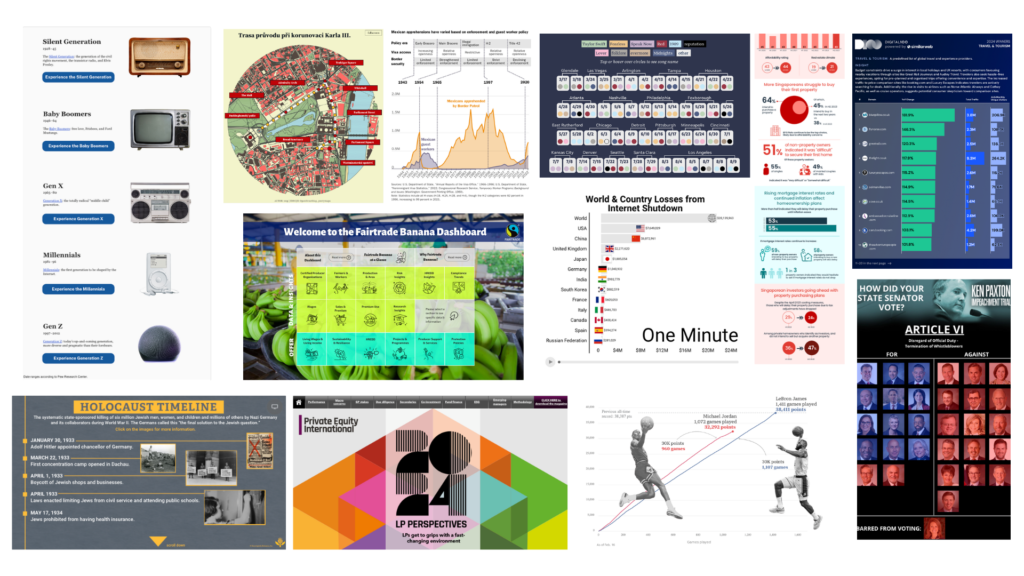
Infogram also highlights the importance of creativity in data visualization. The examples of data visualizations created by Infogram users in 2024 showcase visual excellence and creativity that continue to drive data storytelling. From interactive charts and dynamic maps to engaging infographics and impactful dashboards, these visualizations highlight the power of design.
Accessibility is a priority on Infogram. The platform allows users to create data visualizations that are understandable even for those without technical backgrounds. This is achieved through the use of vibrant colors, clear labels, and detailed explanations. The visual approach makes data more engaging and accessible to a broader audience.
Data accuracy is fundamental to the credibility of visualizations. On Infogram, data is carefully verified and presented clearly to avoid the spread of misinformation. This is essential to maintain public trust and ensure that data-driven decisions are informed and accurate.
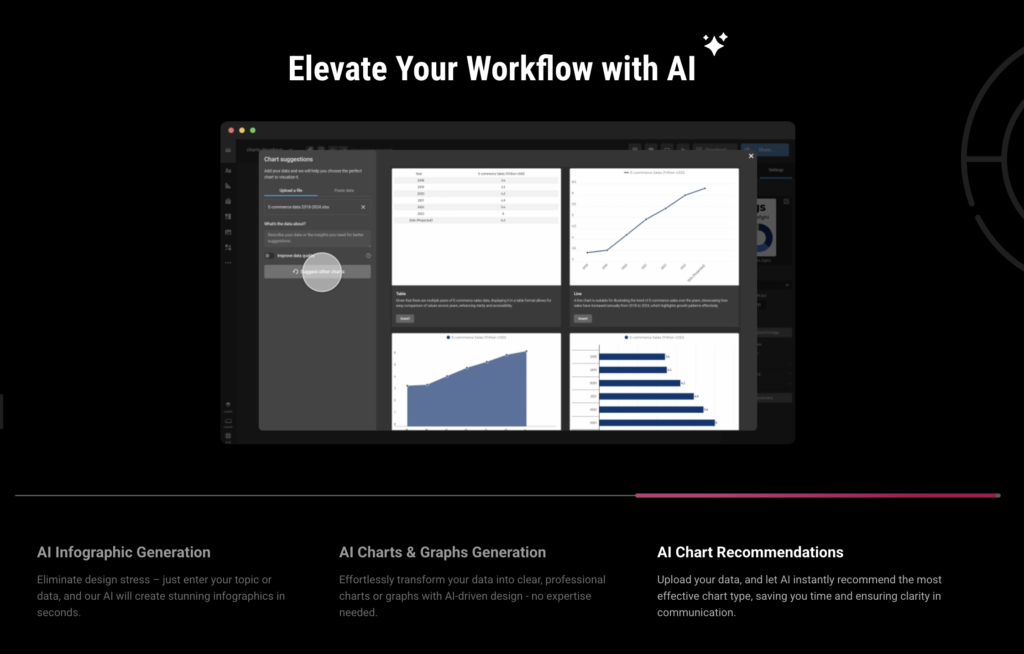
Innovation is a hallmark of Infogram. The platform frequently introduces advanced AI functionalities to enhance user experience and accessibility. These innovations enable users to create more engaging and interactive data visualizations, elevating data storytelling to new heights.
Collaboration is another important aspect of Infogram. The platform allows teams to work together to create accurate and informative data visualizations. This collaboration between designers, data analysts, and experts ensures that visualizations are effective and impactful.

Visual storytelling is a powerful tool for engaging the audience. Visualizations on Infogram are not only informative but also visually appealing. This helps capture the audience’s attention and maintain interest in the presented information. The combination of accurate data and engaging storytelling makes data communication more effective.
Education is a central goal of Infogram. Data visualizations are designed to be used as educational tools in classrooms and other learning environments. This helps promote data literacy and inspire the next generation of scientists and engineers.
Sustainability is a recurring theme on Infogram. Many projects highlight the importance of conservation and environmental sustainability. For example, visualizations about zero-waste lifestyles help raise awareness about the importance of environmental preservation.
Data storytelling is also used to highlight important social issues. On Infogram, users can create visualizations that emphasize the importance of issues such as mental health, social inequality, and sustainability. This helps contextualize the data and highlight its relevance to current issues.
Creativity is a distinctive feature of Infogram. The platform allows users to experiment with different visualization and storytelling techniques to create unique and engaging projects. This creative approach helps make data communication more accessible and interesting to a broader audience.
Transparency is fundamental to the credibility of visualizations. On Infogram, users can share the source code and data used in their projects, allowing others to verify and replicate their visualizations. This promotes transparency and trust in the presented information.
In conclusion, Infogram demonstrates the power of data visualization and data storytelling in effective data communication. By combining accurate data with engaging narratives, the platform makes data communication more accessible and interesting to the general public. Infogram’s innovative and collaborative approach serves as a model for effective data communication.
#datavizmagic #tools #datastorytelling #datavisualization #infogram