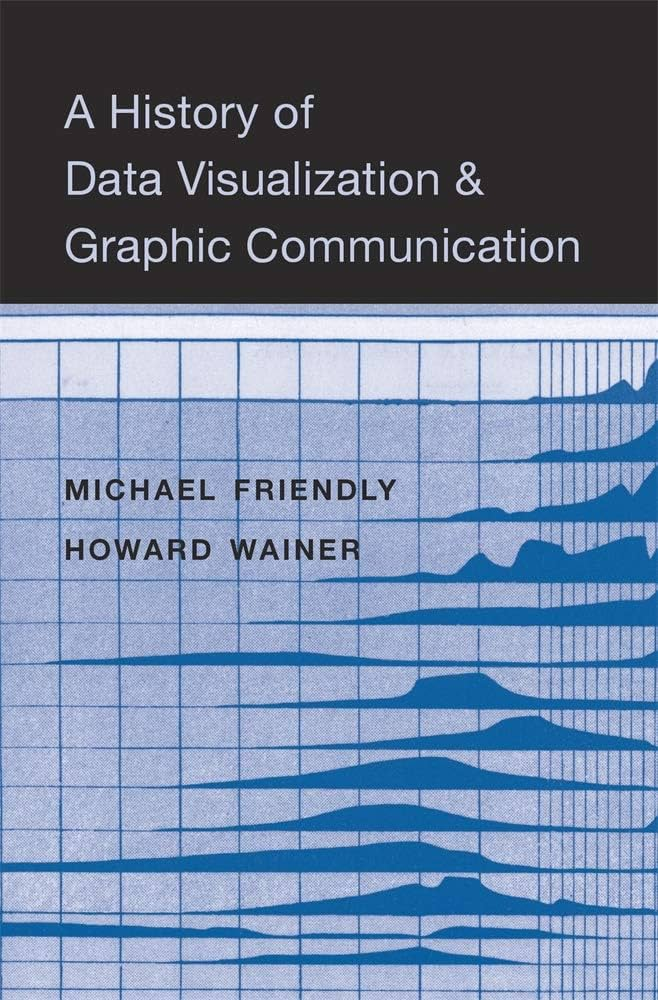
A History of Data Visualization and Graphic Communication by Michael Friendly and Howard Wainer is a comprehensive exploration of the evolution of data visualization and its impact on how we understand and solve problems. The book delves into the origins, rise, and significance of graphic communication, highlighting its indispensable role in our daily lives.
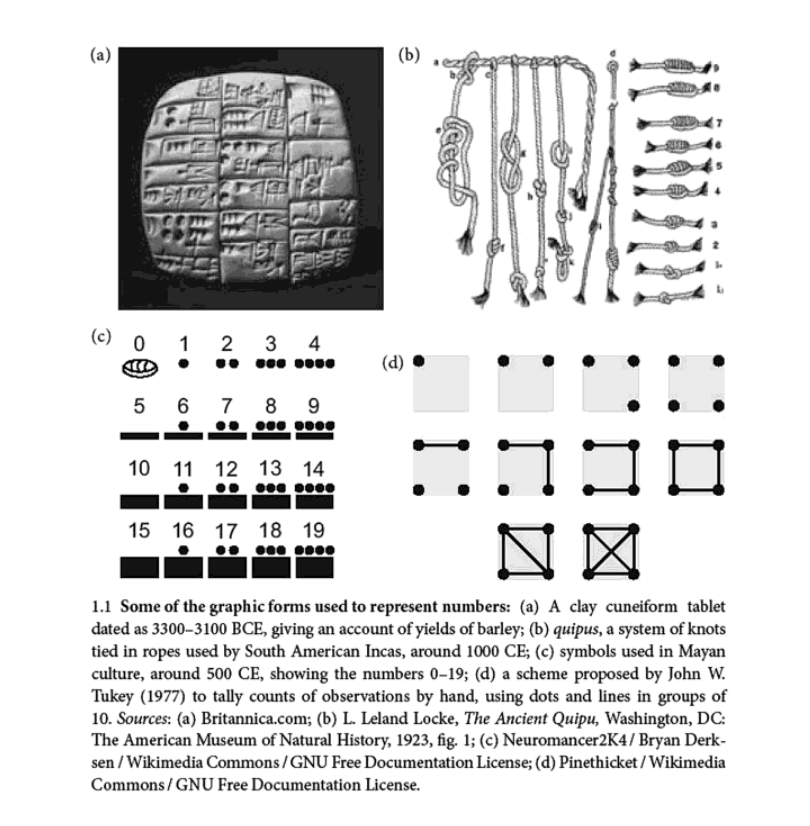
The authors begin by tracing the roots of data visualization back to the mid-seventeenth century, when the Dutch cartographer Michael Florent van Langren created the first chart of statistical data. This early attempt at visualizing data marked the beginning of a journey that would revolutionize the way information is presented and understood.
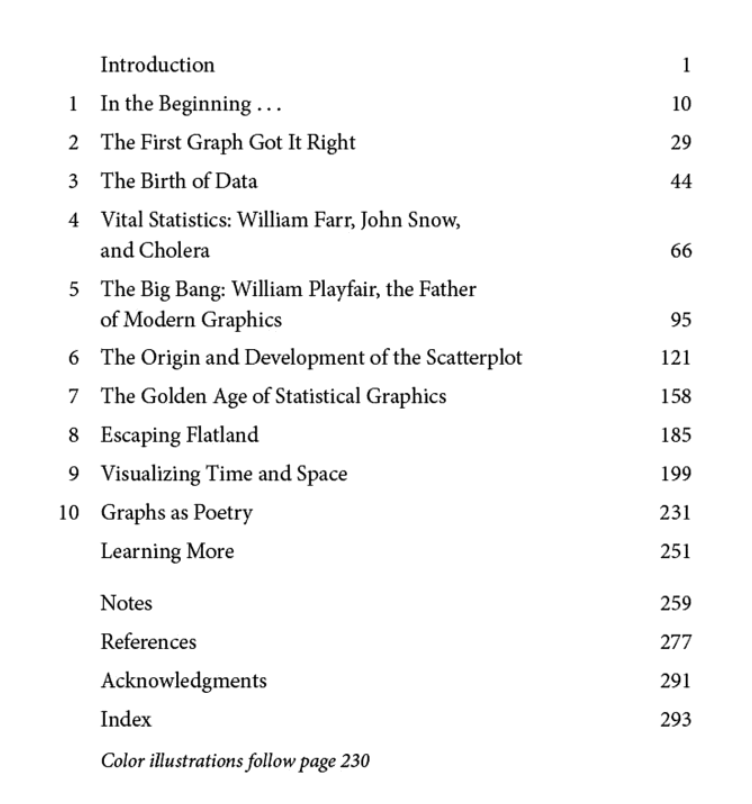
As the book progresses, it covers the contributions of key figures in the history of data visualization, such as William Playfair, who invented the line graph and bar chart in the late eighteenth century. These innovations provided new ways to represent complex data, making it more accessible and easier to interpret.
The nineteenth century, often referred to as the “golden age” of data display, saw significant advancements in the field. During this period, data visualization was used to track disease outbreaks, understand social issues, and communicate scientific discoveries. The authors provide detailed accounts of how these visual tools were employed to address real-world problems.
In the modern era, data visualization has become an integral part of our daily lives. From navigation apps showing real-time traffic data to color-coded maps detailing election results, graphics are now essential for making sense of the vast amounts of information we encounter. The book explores how these tools have evolved and their impact on decision-making processes.
Friendly and Wainer also discuss the challenges and opportunities presented by the digital age. With the advent of new technologies, data visualization has become more interactive and dynamic, allowing for more sophisticated analyses and presentations. The authors highlight the importance of staying current with these advancements to effectively communicate complex information.
The book concludes by examining the future of data visualization and its potential to further transform how we think and solve problems. The authors emphasize the need for continued innovation and adaptation in the field, as well as the importance of educating future generations about the power of visual communication.
Overall, A History of Data Visualization and Graphic Communication is an essential read for anyone interested in the evolution of data visualization and its profound impact on society. The book provides a thorough and engaging account of how graphic communication has shaped our understanding of the world and continues to be a vital tool in addressing contemporary challenges.
About the Authors:
Michael Friendly is a professor of psychology at York University, Toronto, and a recognized expert in the field of data visualization. He has authored numerous books and articles on the subject, contributing significantly to the understanding and development of graphical methods for data analysis.
Howard Wainer is a distinguished research scientist and statistician, known for his work in the field of psychometrics and graphical methods. He has published extensively and has been a pioneer in the use of visual displays to enhance the understanding of complex data.
Link to Buy: A History of Data Visualization and Graphic Communication
+VIDEO: