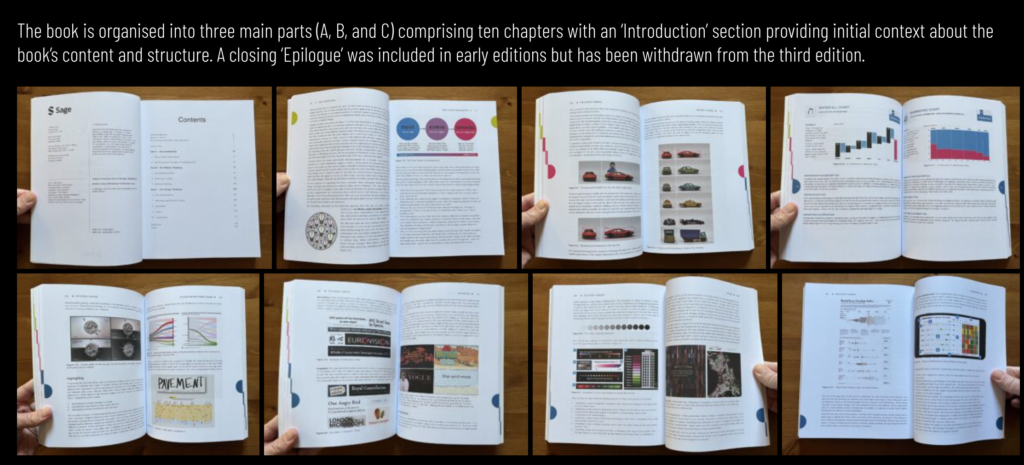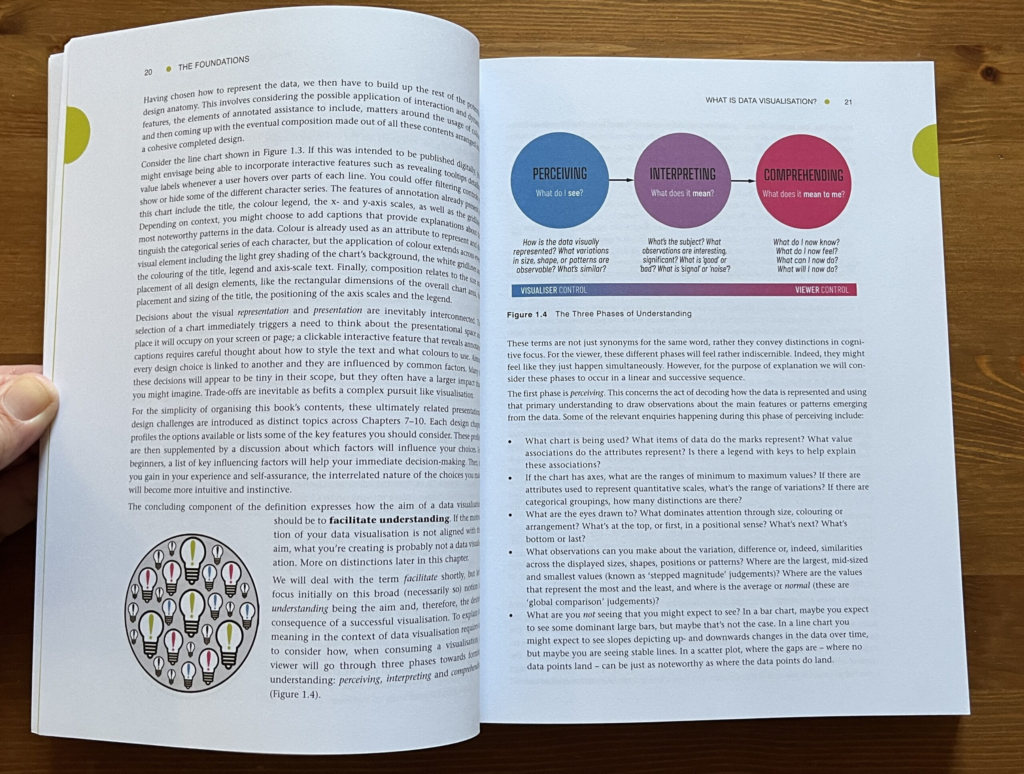
Data Visualisation: A Handbook for Data Driven Design, written by Andy Kirk, is an essential work for students, academics, and professionals who want to master the art of creating effective data visualizations. This book, now in its second edition, offers a comprehensive and practical approach to transforming data into impactful and useful communication tools.
The book begins with an introduction to the concept of data visualization, highlighting its importance in the modern world, where the amount of available information is immense. Kirk emphasizes that data visualization is not just about creating beautiful charts, but about communicating information clearly and accurately. He explores the fundamental principles that should be considered when creating visualizations, such as the choice of colors, shapes, and types of charts.
Next, Kirk guides readers through the process of data analysis. He explains how to identify the right questions to ask and how to select the most relevant data to answer those questions. The author also addresses techniques for cleaning and preparing data, ensuring that visualizations are based on accurate and reliable information.
The central part of the book is dedicated to the design of visualizations. Kirk presents a series of practical examples, showing what works and what doesn’t in different contexts. He discusses the importance of considering the target audience and the purpose of the visualization when choosing the appropriate design. Additionally, the author offers tips on how to use software tools to create professional visualizations.

Another important aspect covered in the book is the curation of information. Kirk explains how to select and organize data in a way that tells a coherent and engaging story. He highlights the importance of maintaining data integrity while seeking to simplify and clarify the message to be conveyed.

The book also includes a section on implementing data visualizations in different platforms and contexts. Kirk discusses how to adapt visualizations for presentations, reports, websites, and mobile apps. He offers advice on how to ensure that visualizations are accessible and understandable to different audiences, including those with visual limitations.
Finally, Data Visualisation: A Handbook for Data Driven Design concludes with a reflection on the future of data visualization. Kirk explores emerging trends and new technologies that are shaping the field. He encourages readers to continue learning and experimenting, emphasizing that data visualization is a constantly evolving discipline.

This book is an indispensable read for anyone interested in transforming data into powerful visual insights. With its practical approach and detailed examples, Andy Kirk offers a complete guide to creating data visualizations that truly make a difference.

About the author:
Andy Kirk is an independent data visualization consultant, author, and speaker, known for his blog visualisingdata.com and for founding Visualising Data Ltd, where he offers consulting and training services. With over a decade of experience, Kirk has worked with clients such as Apple and Google, and has taught at renowned institutions like Imperial College and UCL. He is the author of four books, including “Data Visualisation: A Handbook for Data Driven Design,” and continues to influence the field of data visualization with his expertise and dedication.
Link to buy: Data Visualisation: A Handbook for Data Driven Design,
+VIDEO:
#datavizmagic #books #datavisualization #datastorytelling #datahandbook

