

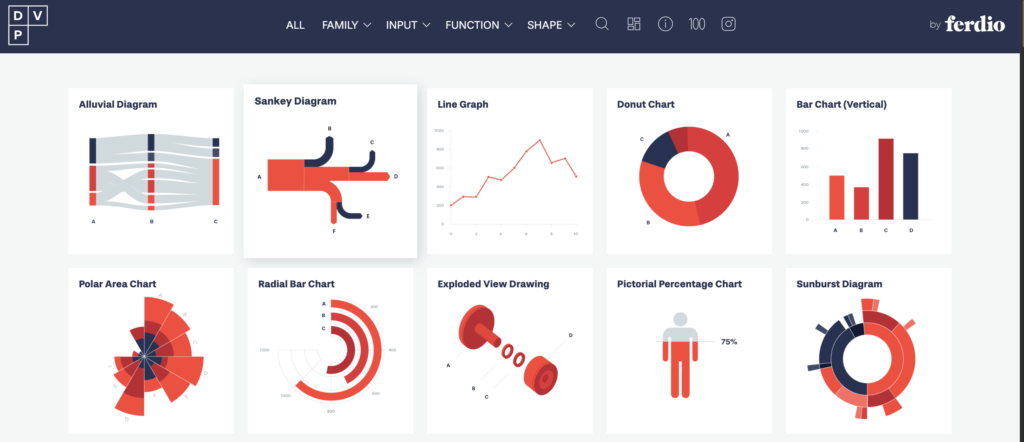
The Data Viz Project is an online platform dedicated to data visualization, created by the agency Ferdio. This site offers a vast collection of data visualization examples, categorized by type, function, and complexity. It serves as a source of inspiration and reference for professionals working with data analysis, helping them choose the best ways to present their information.
For data analysts, the Data Viz Project is an essential tool for several reasons. Firstly, it provides a wide variety of visualization examples, from simple charts to more complex representations. This allows analysts to quickly find the type of visualization that best suits their data and specific objectives.
Additionally, the site is intuitively organized, making it easy to navigate and search for specific visualizations. Each example is accompanied by a detailed description, explaining when and how to use that visualization. This is particularly useful for analysts who are learning new techniques or looking for innovative ways to present their data.
The Data Viz Project is also important for its ability to inspire creativity. By exploring different types of visualizations, analysts can discover new ways to communicate their findings and insights. This can lead to more impactful and comprehensible presentations, which is crucial for data-driven decision-making.
Another valuable aspect of the site is its constant updates. New visualization examples are regularly added, ensuring that users have access to the latest trends and techniques in data visualization. This is essential in a constantly evolving field, where new tools and methods are always emerging.
For those working in teams or collaborating with other departments, the Data Viz Project can serve as a common resource to standardize data presentation. Having a shared reference point can improve consistency and clarity in communications within the organization.
Additionally, the site offers educational resources, such as tutorials and articles, that help analysts enhance their data visualization skills. These resources are valuable for both beginners and experienced professionals who want to stay updated with industry best practices.
Finally, the Data Viz Project is a tool that promotes efficiency. By providing ready-made and well-documented examples, it saves analysts time, allowing them to focus more on data analysis and interpretation rather than creating visualizations from scratch.