Fundamentals of Data Visualization” by Claus O. Wilke is a comprehensive guide designed to help data scientists and analysts create informative and compelling visualizations. The book emphasizes the importance of accurately representing data while making it visually appealing and easy to understand.
Wilke begins by discussing the principles of good data visualization, stressing the need for clarity, simplicity, and accuracy. He explains how to choose the right type of visualization based on the data and the story you want to tell. This foundational knowledge is crucial for anyone looking to improve their data visualization skills.
The book covers a wide range of visualization types, including bar charts, line graphs, scatter plots, and more complex visualizations like heatmaps and network diagrams. Each type is explained in detail, with examples that illustrate their best uses and common pitfalls to avoid.
One of the key strengths of the book is its practical approach. Wilke provides numerous examples and case studies that show how to apply the principles of data visualization in real-world scenarios. This hands-on approach makes the book a valuable resource for both beginners and experienced professionals.
Wilke also addresses the technical aspects of creating visualizations, including the use of software tools like R and ggplot2. He provides code snippets and detailed instructions, making it easier for readers to implement the techniques discussed in the book.
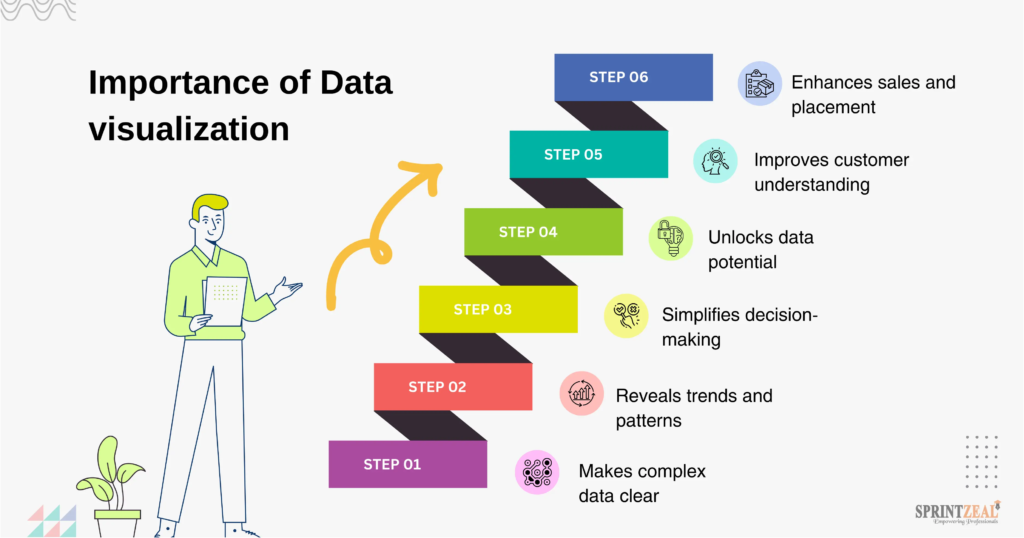
The book emphasizes the importance of storytelling in data visualization. Wilke explains how to craft a narrative that guides the viewer through the data, highlighting key insights and making the information more engaging and memorable. This focus on storytelling sets the book apart from other technical guides.
In addition to technical skills, Wilke discusses the cognitive aspects of data visualization. He explains how people perceive visual information and how to design visualizations that are intuitive and easy to interpret. This understanding of human perception is essential for creating effective visualizations.
Wilke also covers the ethical considerations of data visualization. He stresses the importance of honesty and transparency, warning against manipulative practices that can mislead viewers. This ethical perspective is crucial for maintaining trust and credibility in data communication.
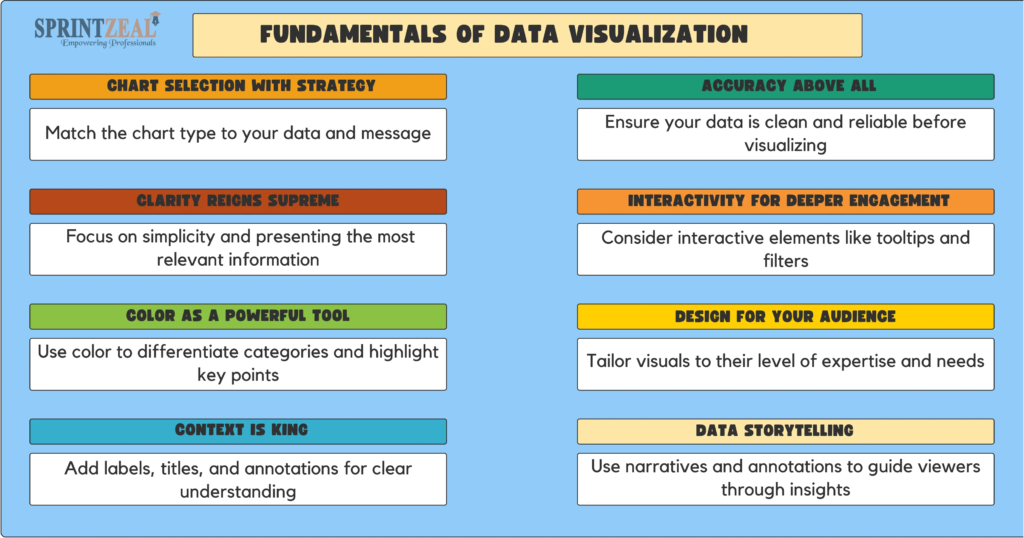
The book includes a chapter on advanced topics, such as interactive visualizations and dashboards. Wilke explores the potential of these tools to provide deeper insights and more dynamic user experiences. This forward-looking perspective is valuable for professionals who want to stay ahead of the curve.
In summary, “Fundamentals of Data Visualization” is an essential resource for anyone involved in data analysis and communication. With its blend of theoretical principles, practical advice, and ethical considerations, the book provides a comprehensive guide to creating visualizations that are both informative and compelling.

About the author:
Claus O. Wilke is a renowned computational and evolutionary biologist, currently holding the position of Jane and Roland Blumberg Centennial Professor in Molecular Evolution at the University of Texas at Austin. He holds a PhD in Theoretical Physics from the University of Bochum, Germany, and received postdoctoral training in biological physics at Caltech.
Wilke has made significant contributions to the fields of computational biology, molecular evolution, protein biochemistry, and virology. He is also known for his work in data visualization, having created several popular R packages such as cowplot, ggridges, and ggtext. Additionally, he is a regular contributor to the widely-used ggplot2 package.
Link to buy: Fundamentals of Data Visualization.
+VIDEO:
#datavizmagic #books #datavisualization #fundamentalsofdata #datastorytelling