-

The Power of Data Storytelling: Lessons from the Map of Napoleon’s March.
•
The map of Napoleon’s march to Russia, created by Charles Joseph Minard, is often cited as an iconic example of data storytelling and data visualization. This graphic not only presents data but tells a powerful story about Napoleon’s disastrous campaign in 1812. Minard managed to synthesize complex information into a…
-

Data Storytelling: Agile Planning for Insight-Driven Communication.
•
Unlocking the Power of Data Storytelling In today’s data-driven world, the ability to communicate insights effectively is crucial. Stefano Carnevalli’s book, “Data Storytelling: Agile Planning for Insight-Driven Communication,” offers a comprehensive guide to mastering this skill. The book introduces the Data Storytelling Canvas, a tool that helps professionals organize their…
-
AI Literacy Fundamentals: Helping You Join the AI Conversation.
•
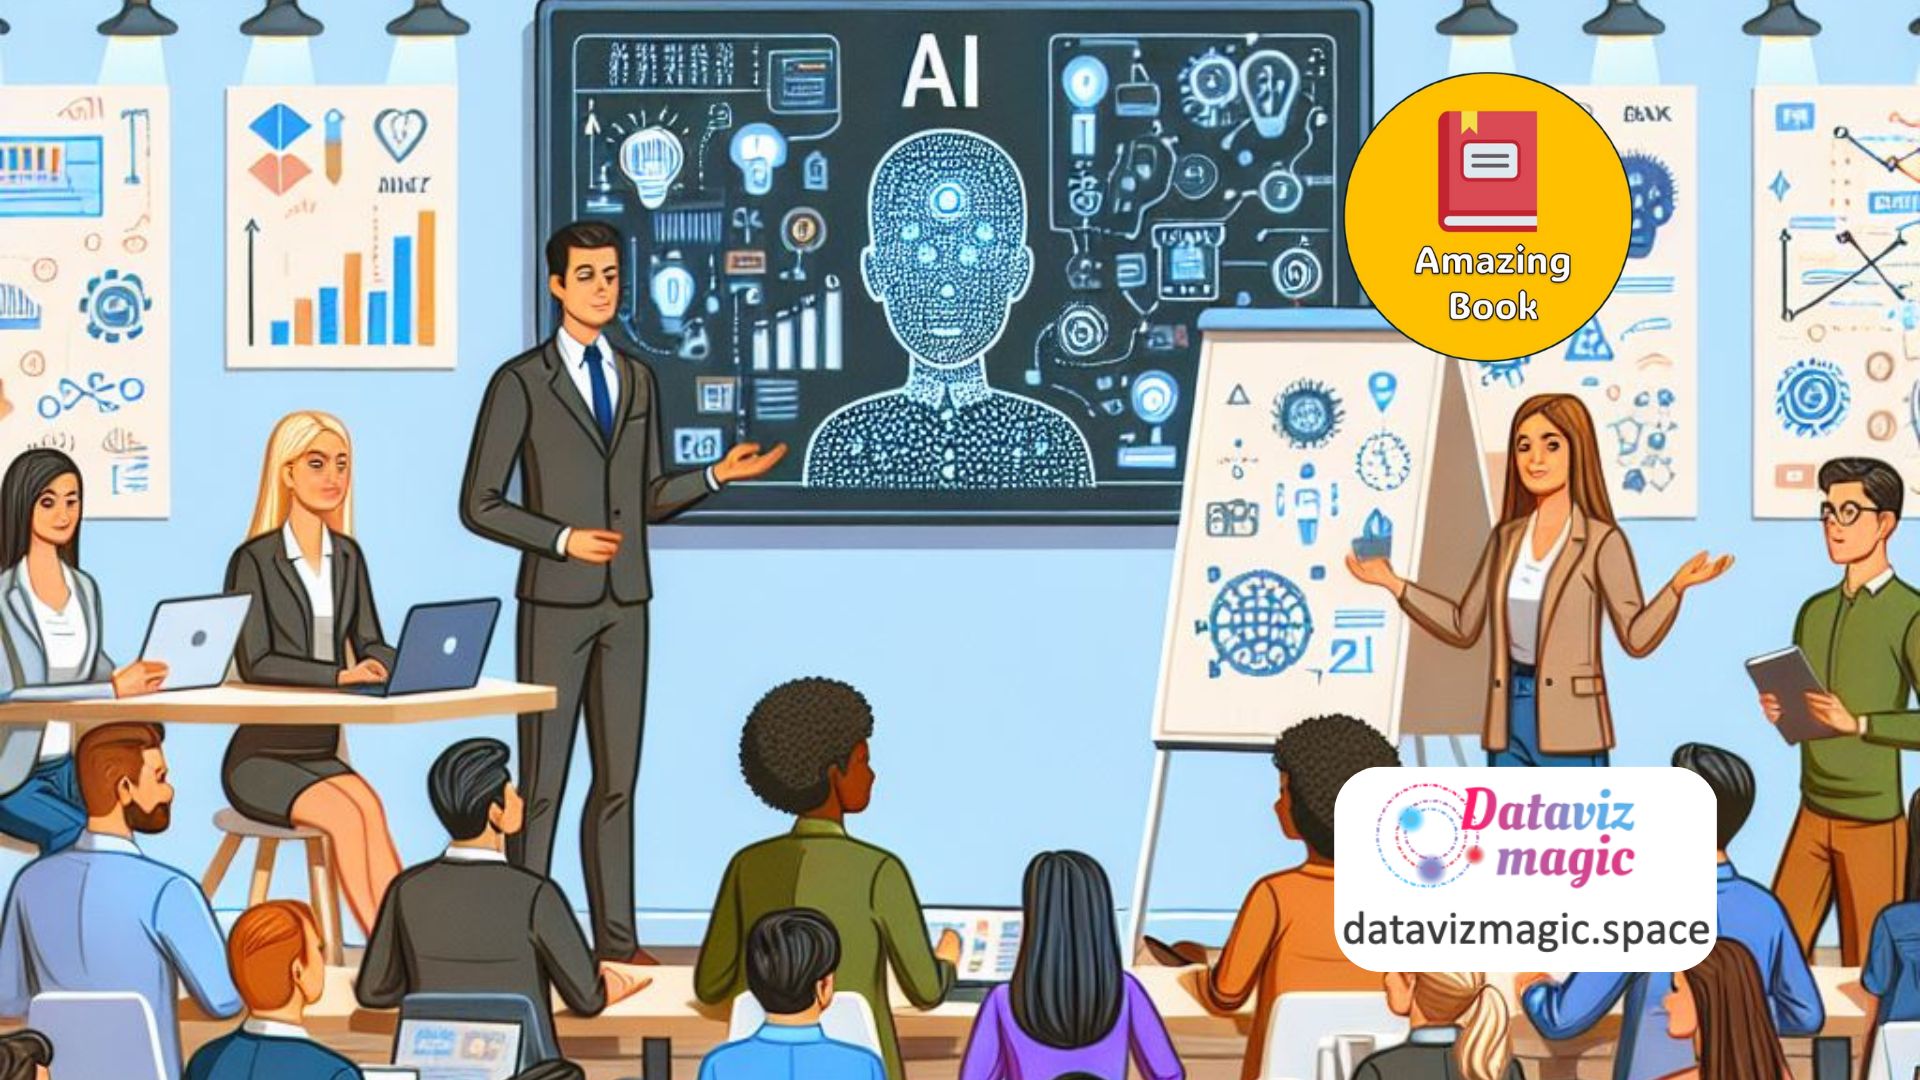
Understanding AI Literacy Artificial Intelligence (AI) is rapidly transforming various aspects of our lives, from how we work to how we interact with technology. However, understanding AI can be daunting for many. “AI Literacy Fundamentals: Helping You Join the AI Conversation” by Ben Jones serves as an essential primer for…
-

Storytelling with Data: A Data Visualization Guide.
•
In today’s data-driven world, the ability to communicate effectively with data is a crucial skill. Cole Nussbaumer Knaflic’s book, “Storytelling with Data: A Data Visualization Guide for Business Professionals,” provides a comprehensive framework for transforming raw data into compelling stories. The first step in this process is understanding the context.…
-

The Data Visualization Catalogue.
•
The Data Visualization Catalogue is an online resource designed to help individuals find the most appropriate data visualization method for their specific data needs. Created by Severino Ribecca, this site serves as a comprehensive guide and library of various data visualization techniques, tools, and resources. It is particularly valuable for…
-

Data Lab – The World Bank.
•
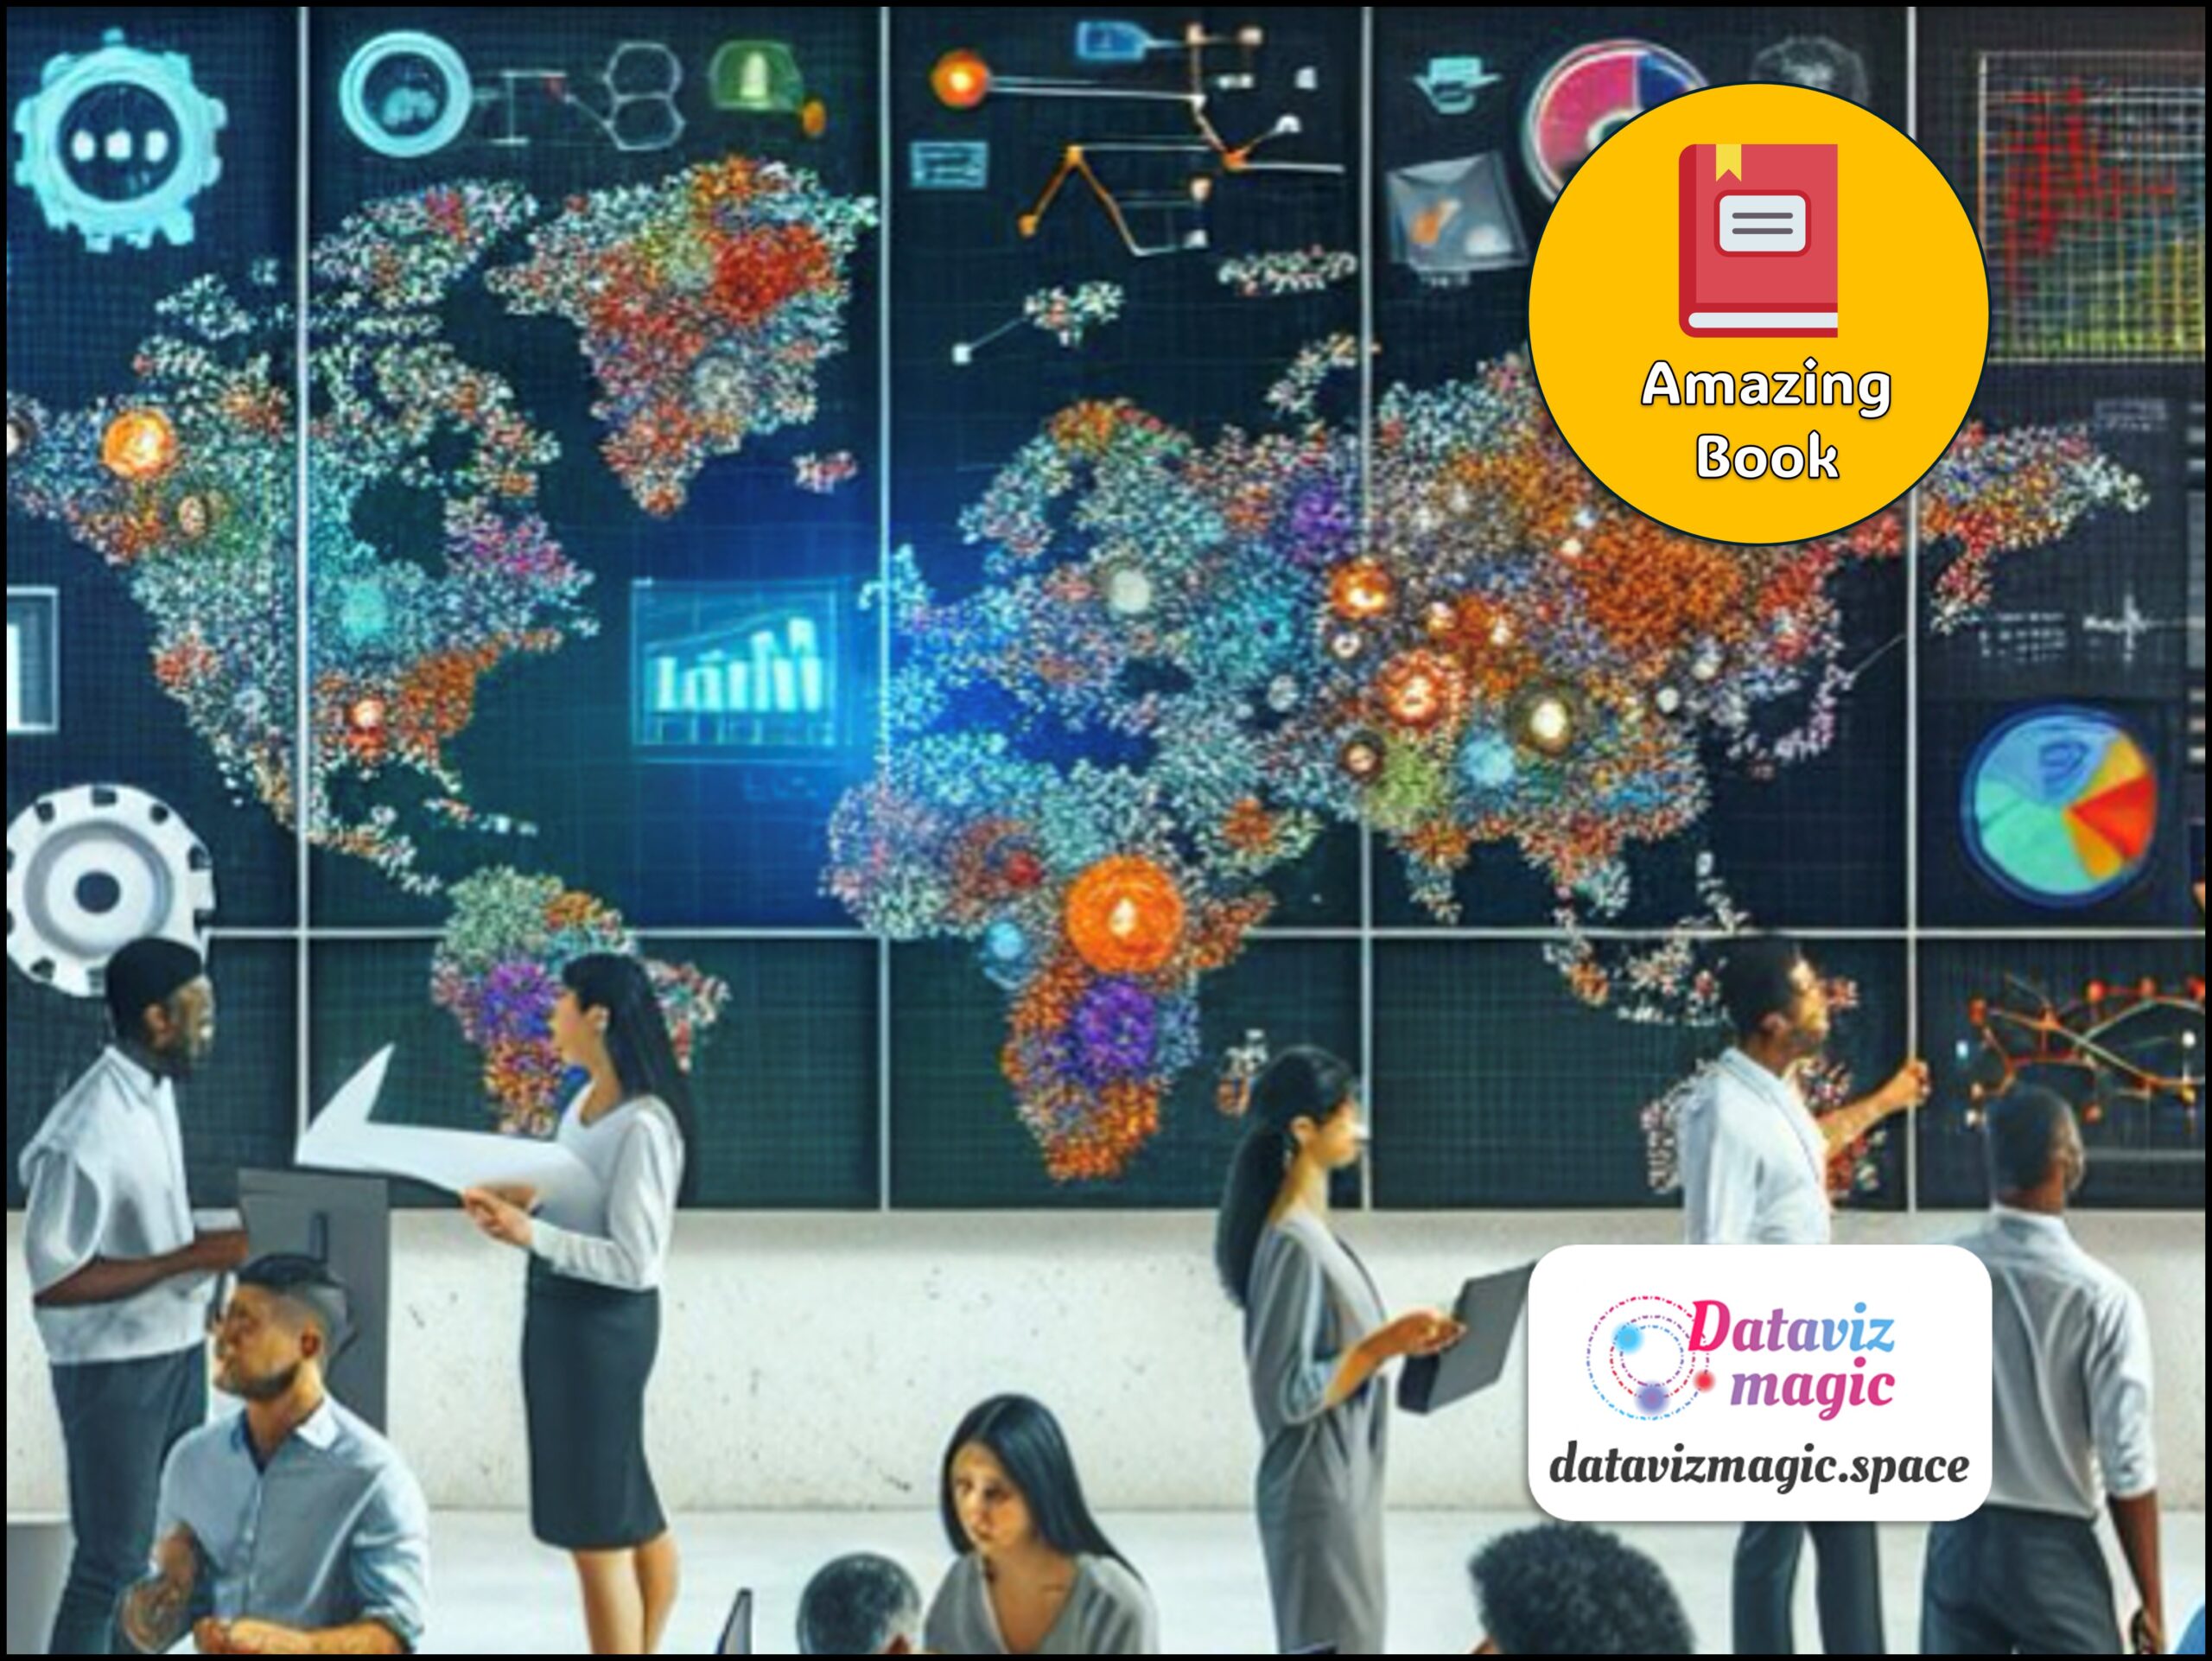
The World Bank Data Lab is an initiative by the World Bank aimed at solving development challenges through data analysis and data science. The site offers a wide range of resources and tools for data professionals, helping to improve internal coordination among the World Bank’s data talents, expand pro bono…
-

The Future of the USA Through the Lens of Data Analysis.
•
Data analysis is fundamental to understanding the demographic transformations occurring in the United States. The country is becoming predominantly non-white while a record share of the population is aging. These simultaneous changes create significant generational gaps that affect politics, the economy, and social cohesion. Demographic data shows that the white…
-
Humanizing Data Strategy: Leading Data with the Head and the Heart.
•
In today’s data-driven world, Tiankai Feng’s book, “Humanizing Data Strategy: Leading Data with the Head and the Heart,” offers a refreshing perspective on data management. Feng introduces the Five Cs Framework, which focuses on Competence, Collaboration, Communication, Creativity, and Conscience. This framework emphasizes the importance of aligning data skills with…
-
Data Analysis and the Cholera Outbreak Map.
•
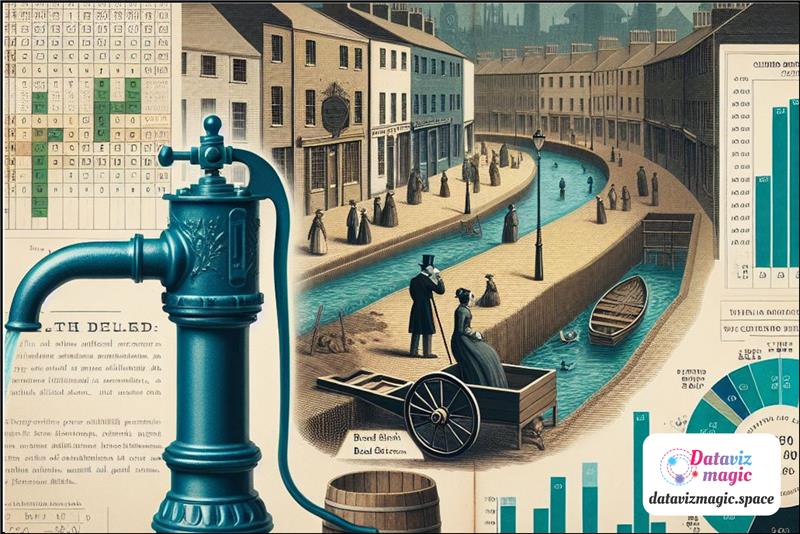
The cholera outbreak on Broad Street in 1854, in London, is a historical event that marked the beginning of modern epidemiology and highlighted the importance of data analysis in public health. At that time, London faced serious sanitation problems, with sewage and drinking water often mixing. Cholera, a disease caused…